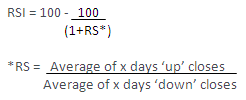
Relative Strength Index is a technical indicator that compares the magnitude of recent losses to recent gains in order to identify overbought and oversold conditions of a stock. If you are keen to know the formula of this indicator, it is as follows:
The value of this indicator could range between 0 and 100 and let's look at this graphically to get a better understanding.

BUY/SELL Signals
If the RSI falls below 30 the stock is oversold and gives a bullish (BUY) signal and if the RSI moves above 70 the share is considered to be overbought and as such gives a bearish (SELL) signal. When you are using the RSI to predict stock price movements you should remember the fact that, large movements up or down in the stock price would result in false buy or sell signals. Therefore, it is very important that you use this tool along with other stock picking tools and not in isolation.
Further, to interpret buy or sell signals you can also look at the RSI along with the price movement of the stock. In the above graph the upper section depicts the price movements of the share and the lower part depicts the RSI ranging from 0 to 100. When the price of a security deviate from the corresponding Relative Strength Index on that security it gives an advance warning of a possible trend reversal. That is to say the Price and the RSI could move in the same direction or in the opposite direction.
You will note from the above graph that the price and the RSI both could either move up or down. If both the price and RSI move up it is a BUY signal and it is a SELL signal if the price and RSI are both falling.
On the other hand, the price and RSI could move in opposite directions. In such an instance, if the price is rising and the RSI is falling it is a SELL signal and when the price is falling and the RSI is rising it is a BUY signal.