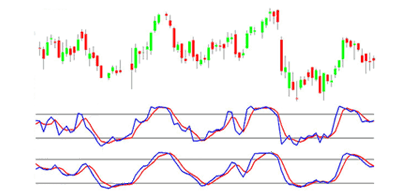
This is yet again another momentum indicator used in technical analysis. The basic idea behind this indicator is that the closing price should close in the same direction as the prevailing trend, if the trend is to be continued. In other words, if the current trend is an uptrend the price should be closing near the highs of the price trend and if the current trend is a downtrend the price should be closing near the lows of the trading range.
This indicator is plotted within the range of 0 to 100 and if the indicator gives a value of above 80 the stock is considered to be overbought and if the value falls below 20 it is considered to be oversold. The overbought or oversold conditions will not always be followed by a trend reversal. However, it will alert the trader to look for further evidence that a reversal may be near.
Two lines are drawn for the Stochastic Oscillator and this indicator is generally calculated for a period of 14 days although the period could be adjusted to suit your requirements. The two lines are arrived at using the following formula:
Caution
We stated earlier that a value of above 80 for the Stochastic Oscillator is considered overbought and a value of below 20 is considered oversold. However, it is important to note that these signals are not that effective when the market is trending upwards or downwards for a longer period of time.
Signals
Stochastic Oscillator gives two kinds of signals. The main signal is given when the %K line crosses the %D line. When the %K line crosses the %D line from below to above it is considered to be a bullish signal and it is a bearish signal if the %K line crosses the %D line from above to below.

In the above graph the solid line is the %K line and the smoothed dotted line is the %D line.
The other signal is arrived at using the %D line (because it is smoothed and as such gives netter signals) and the actual movement of prices. When the %D line and the price line moves away from each other a signal is given that there is a weakening in the current trend.
More precisely, if the price line is moving upward and the %D line is moving downward this is a bearish signal and if the price of the security is moving downward and the %D line is moving upward that is considered to be a bullish signal. The signal is thought to be stronger if the %D line is situated in the overbought and oversold range of the Oscillator (i.e. above 80 or below 20). The signal is completed when the %K line crosses the %D line in the opposite direction of the price trend.
Find it a little bit confusing? Let's look at this in a graphical interpretation.
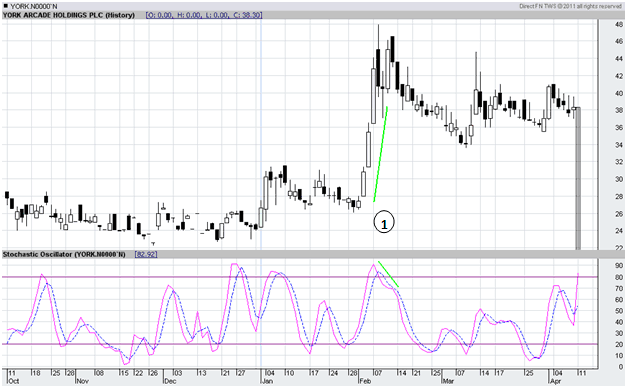
If you look at point marked "1" on the above graph, the %D is sloping downwards whereas the price line is sloping upwards and as such gives a bearish signal to the investor.
On the other hand, if the %D line is upward sloping whereas the price line is sloping downwards and gives a bullish signal.