
Commonly known as MACD, is an indicator that signals trend movements. This is a lagging indicator and can be used with other charts and patterns as a conformational tool. The MACD line is arrived at by subtracting a 26 day moving average from a 12 day moving average. A 9 day moving average of the difference between the 26 and 12 day moving averages is drawn as the signal line. This is the most common period used by analysts but other time periods could also be used.
BUY/SELL signal
The MACD is supposed to give BUY or SELL signals in three ways. The signals are given with crossovers of MACD and the signal line, divergences of MACD from the security price line and with sharp rises of the MACD line.
Crossovers of MACD and the signal line are easy to spot and interpret. When the MACD line falls below the signal line, it is considered to be a SELL signal. And if the MACD rises above the signal line it is a BUY signal. Let's look at this graphically.

The dotted line is the signal line whereas the solid line is the MACD. You will observe that after the MACD crosses the signal line from above to below it is a SELL signal and the accompanying stock chart confirms the downward trend. However, you will also observe that the signal is given after the stock has started its downward trend. But it can be used as a tool to confirm the stock's downward trend.
A problem arises when the stock is moving sideways (that is to say the prices are moving up and down without an identifiable trend), there will be many crossovers and you simply cannot buy and sell at all these signal points. In such an instance the signals will have to be used in conjunction with other formations as well.
Another signal is given when the MACD diverges from the security's prices. That is when the MACD and the security price line moves in opposite directions. When this happens it is signals that the current trend is over and you should structure your BUY or SELL decision accordingly.
You would remember from our earlier discussions that a downtrend is confirmed with successive lower highs and lower lows. If you see the graph below the price line confirms the downtrend with a lower low. However, the MACD line shows less downside momentum with a higher low. This is considered to be a sign of the reversal in the current downtrend.
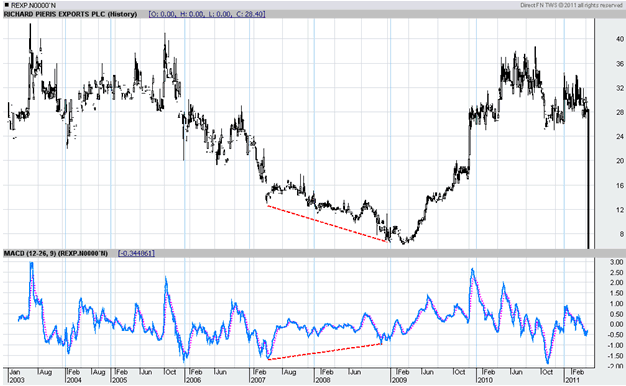
The above chart depicts a bullish divergence which signals a reversal in the current downtrend.
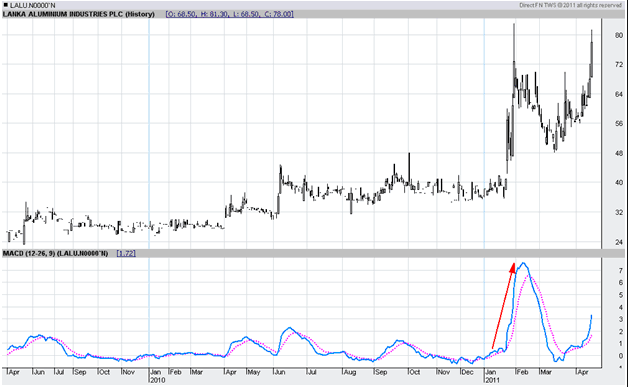
The other signal is given when the MACD rises dramatically and is a signal that the security is overbought and will soon return to its normal levels. As the chart below shows the MACD rises significantly which could mean that the security is oversold. This sharp increase is followed by an equally sharp decline which brings the price back to normal levels.
As a closing comment we would remind you to use this indicator with other techniques before taking the final BUY or SELL decision.


