painofhell

 Posts : 669 Posts : 669
Birthday : 1990-05-18
Join date : 2014-08-16
Age : 34
Job/hobbies : forex
 |  Subject: technical analysis Subject: technical analysis  Wed Aug 20, 2014 3:04 pm Wed Aug 20, 2014 3:04 pm | |
| Using Technical Analysis in ForexTechnical Analysis is the art of reading the price charts and using the historical information to predict what is likely to happen next. This means from as far back as you can see right up to the last second that just passed. The concept is that these price charts are a reflection of all historical to current market information and that history tends to repeat itself. If you learn to read the price action of the charts you will also be able to see how all the fundamentals are being reacted to and what the most likely next trade will be.Before we move on you need to make sure that one thing is clear. The market moves because of all the fundamentals, plain and simple. There should be no debate here, events occur, data is released, and figure heads speak, this is what determines the economic state of any currency. However, it is the opinion here at ElectroFX that it is easier to master technical analysis than it is to master fundamental analysis. Technical analysis can show you how the World is reacting, where the actual prices of supply and demand are located, and present you with opportunities to basically just join in.History Repeats ItselfYou may be wondering what is meant by history repeating itself and a picture of a chart is the best way to explain. Point ‘A’ on this image shows you an area where price reacted substantially and headed on down. This clearly shows you where it was widely accepted that there was too much supply of the base currency and so selling took place.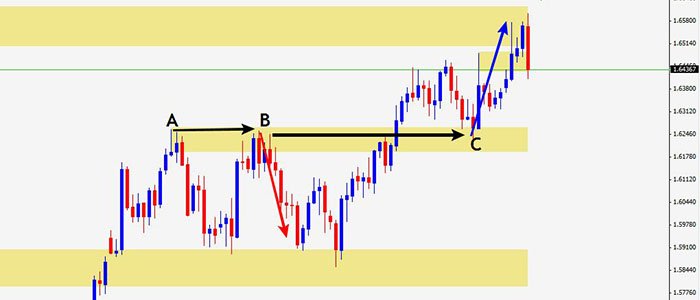 As you can see at Point ‘B’ on this image history repeated itself and selling from that area took place once more. As a technical analyst you would be able to read the likelihood of this occurring and participate in the movement. After you see such a reaction in that same price area you have more yet proof of how significant this area really is. Later on once the price area is broken it becomes very likely that it will later react as if viewed in a mirror (You will learn all about this later). Point ‘C’ in the image shows you just that and as a technical analyst you would be able to participate in the buying as the history of trading from this area repeats itself again.It is worth noting that this is not an image that took some searching to find, this is the recent history of the GBPUSD as this lesson is written. This is just how the laws of supply and demand are displayed in the format of a price action chart. Supply and demand itself may be determined via the fundamentals of the planet but the charts will reflect it in a visual format. It is up to you if you wish to become a fundamental or technical analyst, or if you can handle it, both. As you can see at Point ‘B’ on this image history repeated itself and selling from that area took place once more. As a technical analyst you would be able to read the likelihood of this occurring and participate in the movement. After you see such a reaction in that same price area you have more yet proof of how significant this area really is. Later on once the price area is broken it becomes very likely that it will later react as if viewed in a mirror (You will learn all about this later). Point ‘C’ in the image shows you just that and as a technical analyst you would be able to participate in the buying as the history of trading from this area repeats itself again.It is worth noting that this is not an image that took some searching to find, this is the recent history of the GBPUSD as this lesson is written. This is just how the laws of supply and demand are displayed in the format of a price action chart. Supply and demand itself may be determined via the fundamentals of the planet but the charts will reflect it in a visual format. It is up to you if you wish to become a fundamental or technical analyst, or if you can handle it, both.  |
|


