mary
Membership NO : 3
Posts : 574
Join date : 2011-04-12
 |  Subject: DanUK's Advanced Trend Trading Strategy Subject: DanUK's Advanced Trend Trading Strategy  Sat May 28, 2011 2:14 pm Sat May 28, 2011 2:14 pm | |
| Real Money Doubling Forex Robot Fap Turbo - Sells Like Candy!ORDER NOW READ MORE ABOUT ITDanUK's Advanced Trend Trading Strategy READ MORE ABOUT ITDanUK's Advanced Trend Trading Strategy
Hello all – welcome to my new thread! Strategy Summary The basic premise of my trading
method is to follow the trend as defined by the higher time frames
(typically 4 hour and above). It is a very simple method that is
essentially made up of four main elements:
- Support & Resistance Levels
- Trendlines
- Fib Retracements
- Candlestick Patterns & Breakouts
This thread is a
development of my original Trend Trading Chart Thread that I started in
August 2009. Since I started that thread my trading has grown and my
strategy has changed slightly. So rather than clutter the old thread
with my new ideas I decided to start a new thread and set out my
strategy as we go. If you haven’t ever visited the
old thread don’t worry – I will explain everything from the beginning
so no need to go back over all the old posts. If you did follow the old
thread please feel free to continue posting there or here – depending on
which variation of the method you prefer! I have called this thread
“Advanced Trend Trading” because the entries and trade management are a
little more refined than before (not rocket science, I still like to
keep it simple!) but the general premise of trend trading remains. I am
also going to talk about some counter-trend trades as a compliment to
the main strategy. I’m afraid that nothing here is
going to be new or exiting – it’s just a concoction of what I have
found to work for me. I am not a professional trader and do not claim to
be (although I would perhaps like to be one day!). Anyone who does want
to try this method of trading should do so on demo only! I cannot guarantee that anyone will be successful following the way I trade
– after all, a great deal of success depends on your own psychological
issues. One of the biggest things you will need to get over to become a
profitable trader is yourself!
Potential Trade SetupsThis thread should be used for educational purposes only. It is not intended to be a signal service. As this thread has grown, a few of us have decided to start posting possible trade setups. These should not be considered signals to trade and there are no guarantees implied or otherwise herein. The trades are shown for educational reasons, to help illustrate what we are looking at and how we might act once in a trade - should you wish to take a trade you should only do so once you have undertaken your own analysis. CFTC RISK DISCLOSURE STATEMENT:
NOTICE: "HYPOTHETICAL
PERFORMANCE RESULTS HAVE MANY INHERENT LIMITATIONS, SOME OF WHICH ARE
DESCRIBED BELOW. NO REPRESENTATION IS BEING MADE THAT ANY ACCOUNT WILL
OR IS LIKELY TO ACHIEVE PROFITS OR LOSSES SIMILAR TO THOSE SHOWN. IN
FACT, THERE ARE FREQUENTLY SHARP DIFFERENCES BETWEEN HYPOTHETICAL
PERFORMANCE RESULTS AND THE ACTUAL RESULTS SUBSEQUENTLY ACHIEVED BY ANY
PARTICULAR TRADING PROGRAM.
ONE OF THE LIMITATIONS OF
HYPOTHETICAL PERFORMANCE RESULTS IS THAT THEY ARE GENERALLY PREPARED
WITH THE BENEFIT OF HINDSIGHT. IN ADDITION, HYPOTHETICAL TRADING DOES
NOT INVOLVE FINANCIAL RISK, AND NO HYPOTHETICAL TRADING RECORD CAN
COMPLETELY ACCOUNT FOR THE IMPACT OF FINANCIAL RISK IN ACTUAL TRADING.
FOR EXAMPLE, THE ABILITY TO WITHSTAND LOSSES OR TO ADHERE TO A
PARTICULAR TRADING PROGRAM IN SPITE OF TRADING LOSSES ARE MATERIAL
POINTS WHICH CAN ALSO ADVERSELY AFFECT ACTUAL TRADING RESULTS. THERE ARE
NUMEROUS OTHER FACTORS RELATED TO THE MARKETS IN GENERAL OR TO THE
IMPLEMENTATION OF ANY SPECIFIC TRADING PROGRAM WHICH CANNOT BE FULLY
ACCOUNTED FOR IN THE PREPARATION OF HYPOTHETICAL PERFORMANCE RESULTS AND
ALL OF WHICH CAN ADVERSELY AFFECT ACTUAL TRADING RESULTS.
That being said, let’s begin…
In
order to define the trend we must first zoom out as far as possible. It
should be clear which way price is going. If it isn’t then it is
probably not worth trading! In an uptrend, each major swing
should make a higher high followed by a retracement making a higher
low. In a downtrend, each major swing should make a lower low followed
by a retracement making a lower high. I typically do my trend analysis
on the daily chart.Attached Thumbnails 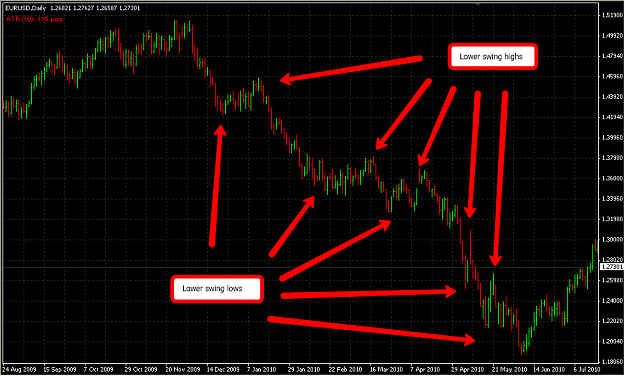 Although Although
I will primarily trade the trend on the daily charts I also enter using
H4 charts so it is important to know where you are in line with the
higher trend. Let’s say for example, we are
trading a 4 hour chart which is showing an uptrend but when we switch to
the daily it looks as though our uptrend is simply a retracement in the
longer term downtrend. Which way do we trade? We trade the 4 hour
uptrend (because that is the timeframe we are looking to trade and is
our trading bias) until such time as the long term trend takes over. The
best way to illustrate is with a chart. A pretty clear upward trend on the H4 chart:Attached Thumbnails 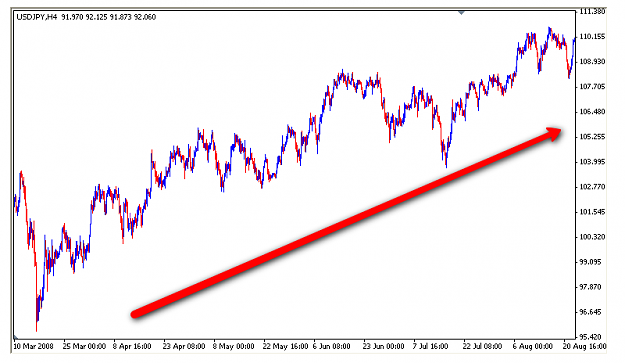 Is actually just a retracement in the longer term (daily) chart: Is actually just a retracement in the longer term (daily) chart:Attached Thumbnails 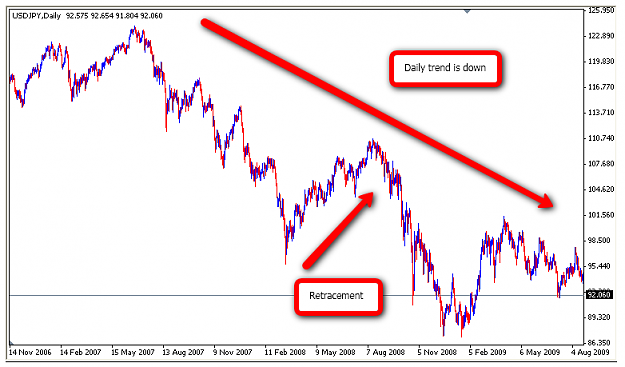 This This
happens often and repeats throughout every time frame in the market. In
this case you simply need to be aware that the daily trend could take
over and so it is worth plotting the longer term (in this case – daily)
trendline too so that you know when/where this might happen. Now we have a trading bias and
we know where we are in relation to higher timeframe trends. Onto the
four elements of my trade setup…_________________ In
my opinion horizontal support and resistance levels are the key to the
market. These are the levels where the big boys are buying and selling
and that should interest us, the retail trader. Much time has been spent in the
past trying to work out the best support/resistance levels to use.
Whether they should be based on the highs and lows or on the close or
median etc etc. In my humble opinion the
easiest way to identify support and resistance levels is to plot a level
and then round it up/down to the nearest round number (i.e. 1.1000,
1.1100, 1.1200 etc). These levels are psychological barriers and tend to
hold the most weight when it comes to using support and resistance
levels. Levels that have been used as both support and resistance hold
the most sway. I would also note that the
bigger the round number, the better. So for example the 1.1000, 1.2000,
1.3000 levels tend to be more important in terms of defining a trend
than the smaller round numbers (1.2400, 1.3300 etc). Here is a random example of how price tends to work with round numbers:Attached Thumbnails 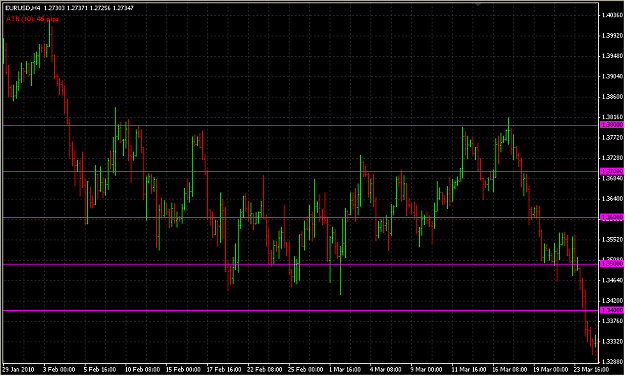 Real Money Doubling Forex Robot Fap Turbo - Sells Like Candy!ORDER NOW Real Money Doubling Forex Robot Fap Turbo - Sells Like Candy!ORDER NOW READ MORE ABOUT IT READ MORE ABOUT IT  |
|
mary
Membership NO : 3
Posts : 574
Join date : 2011-04-12
 |  Subject: Re: DanUK's Advanced Trend Trading Strategy Subject: Re: DanUK's Advanced Trend Trading Strategy  Sat May 28, 2011 2:17 pm Sat May 28, 2011 2:17 pm | |
| Real Money Doubling Forex Robot Fap Turbo - Sells Like Candy!ORDER NOW READ MORE ABOUT ITOk, READ MORE ABOUT ITOk,
so now we know where we are looking to trade (those nice round numbers)
we need an idea of where to get in. Trading with the trend is about
getting in on a discount and when price retraces I use trendlines and
the fib retracement tool to guide me to the best locations. Contrary to popular belief,
trendlines do not have to be drawn from three or more touches. A two
touch trendline works fine too. I tend to draw outer trendlines using
the extreme highs and lows and occasionally draw inner trendlines when
price is moving in-between the outer trendlines.Attached Thumbnails 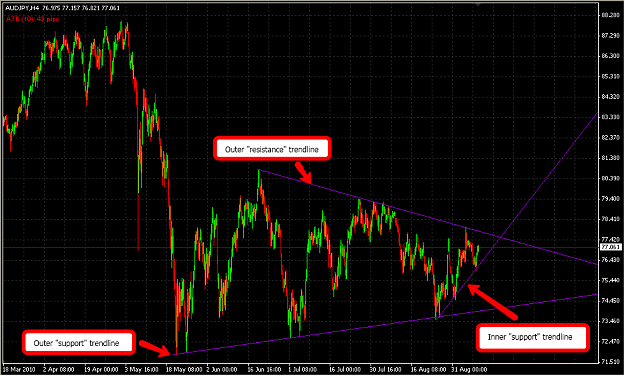 I I
will also use the fib retracement tool (drawn over the most recent
swing in the direction of the trend) to guage how far price is retracing
before I want to get in. A discount becomes of interest when price has
retraced at least 38.2% of the most recent swing but ideally it should
reach the 50% level before we have had a sufficient retracement. The
only time this is superseded is when a very strong support/resistance
level gets in the way or when a trendline gets in the way. Here’s a closer look at my last chart showing the fib retracement…Attached Thumbnails 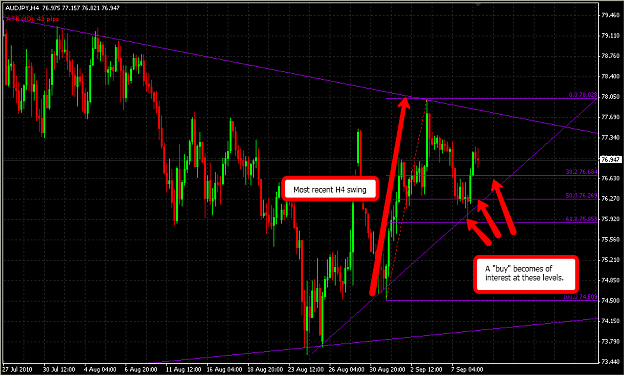 Once Once
we have a trendline or two and a fib retracement in place I will look
at the round numbers that fall nearby… these will then become “areas of
interest” and a place to look for an entry signal. In my previous trend trading
thread we would enter at one of the levels discussed above, stick on a
stop loss anywhere from 100 pips and up and let the market work it out. I
have since become a little more conservative with my entries and a
little more refined too. I will now look for a certain
candlestick pattern or a breakout to develop at one of our areas of
interest. Not just any pattern though, I will typically only use one of
the following patterns as I find them to be most reliable: Shooting
Stars and Hammers (also known as pin bars), Bullish/Bearish Engulfing
Bars and Bullish/Bearish Outside Bars. I suspect that most people will
be familiar with these patterns but for those who aren’t I will post
some pictures and explanations in my next post. Breakouts can be easily
recognisable in the form of the “inside bar” setup or a trendline
breakout. A brief explanation of these setups follows…
A
hammer is a buying signal and should form at a swing low. Ideally the
open and close of the bar should be contained within the previous bar
(but not necessarily essential).Attached Images 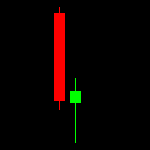 A A
shooting star is a selling signal and should form at a swing high.
Ideally the open and close of the bar should be contained within the
previous bar (but not necessarily essential).Attached Images 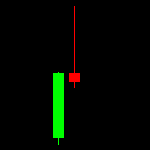 A A
bullish engulfing or outside bar is obviously a buying signal and
should form at a swing low. To classify as an engulfing bar the body
should completely engulf the body of the previous bar. An outside bar
forms similarly but the emphasis is more on the close being higher than
the open and close of the previous candle.Attached Images 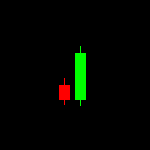 A A
bearish engulfing or outside bar is obviously a selling signal and
should form at a swing high. To classify as an engulfing bar the body
should completely engulf the body of the previous bar. An outside bar
forms similarly but the emphasis is more on the close being higher than
the open and close of the previous candle.Attached Images 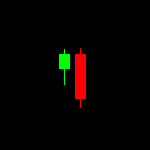 An An
inside bar shows price consolidating before a breakout. The inside bar
is completely engulfed by the previous bar. At a swing high I will look
for a break below the “engulfing” bar and at a swing low I will look for
a break above the “engulfing” bar.Attached Images 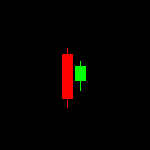 If If
price is retracing against our main trend but is respecting an opposing
trendline as it goes we can use that when the trendline breaks as
another way to get into a move.Attached Thumbnails 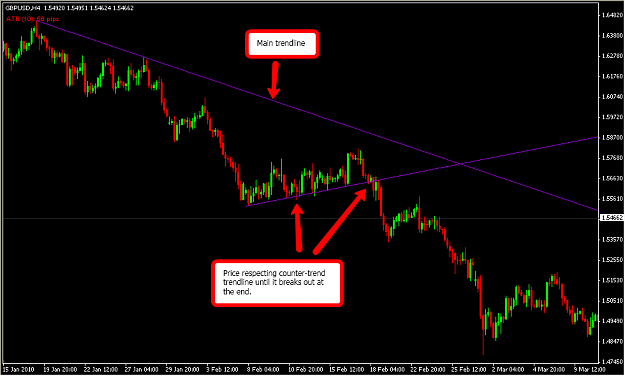 Ok, that is as much as I've written so far! I haven't yet touched what is most likely the most important subject of trade management. It's getting late here now and I need to head off for a rest. If anyone is interested in this method of trading please let me know and I will continue tomorrow with trade management. I will also talk about counter-trend trades too. Hope you all enjoy what I have to offer. Like I said - it's not ground breaking stuff but it works for me and a few others too! Regards, Real Money Doubling Forex Robot Fap Turbo - Sells Like Candy!ORDER NOW READ MORE ABOUT IT READ MORE ABOUT IT  |
|
