Japanese Candlesticks is one of the most popular types of technical analysis in the currency market. It came from Japan in XVIII century and is of high demand among world traders to the present day. Japanese candlesticks got their name from the chart shape, as its elements visually resemble candlesticks. The chart reflects correlation of price opening and closing levels, and show maximum and minimum points of a price band within certain time frames.
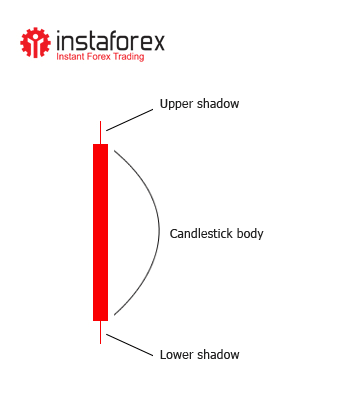
The system of chart coordinates is a cylinder called a candlestick body which outlines the range between opening and closing prices.
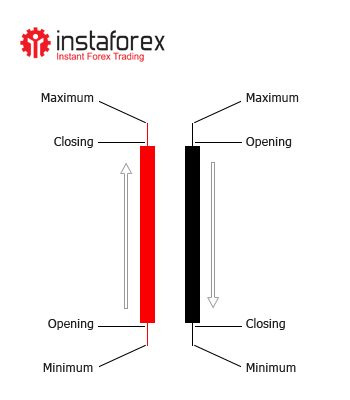
The lower horizontal line shows the opening price (open), the upper one is closing price (close). Upper and lower vertical lines show maximal (high) and minimal (low) prices. Depending on a currency rate change for some period, the candlestick body is colored into a certain color, as a rule, into black or white.
Interpretation rules of Japanese candlesticks chart:
• Equal values of opening and closing prices are shown as one horizontal line on a chart, and the candlestick body takes a christcross form
• In case the opening price exceeds the closing one, the body becomes black-colored denoting the market downtrend.
• In case the opening price is below the closing one, the body remains white denoting the market uptrend.
• The candlestick body outlines the gap between opening and closing prices.
• As soon as all candlestick elements are fixed and the body is completed, the chart moves to the right and a new candlestick takes its rise in another time frame.
In such a way, the chart is a candlestick sequence reflecting the price movement dynamics and allowing a trader not to waste time with calculations.